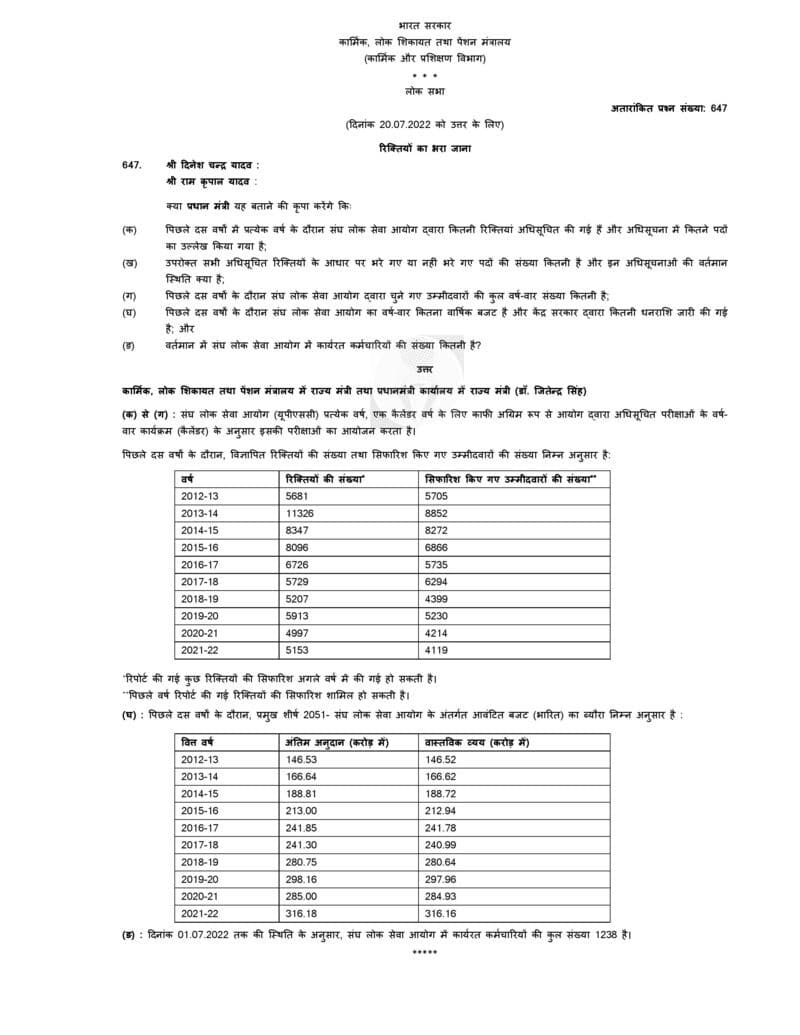
Filling up the Vacancies through UPSC in last 10 years
GOVERNMENT OF INDIA
MINISTRY OF PERSONNEL, PUBLIC GRIEVANCES AND PENSIONS
(DEPARTMENT OF PERSONNEL & TRAINING)
LOK SABHA
UNSTARRED QUESTION NO. 647
(TO BE ANSWERED ON 20.07.2022)
FILLING UP THE VACANCIES
†647. SHRI DINESH CHANDRA YADAV:
SHRI RAM KRIPAL YADAV:
Will the PRIME MINISTER be pleased to state:
(a) the number of vacancies notified by UPSC and the number of posts mentioned in the notifications during the last ten years, year-wise;
(b) the number of posts filled/not filled on the basis of all the above mentioned notified vacancies and the present status of these notifications;
(c) the total number of candidates selected by UPSC during the last ten years, year-wise;
(d) the quantum of annual budget of UPSC and the year-wise amount released by the Union Government to UPSC during the last ten years; and
(e) the number of employees working in UPSC at present?
ANSWER
MINISTER OF STATE IN THE MINISTRY OF PERSONNEL, PUBLIC GRIEVANCES AND PENSIONS AND MINISTER OF STATE IN THE PRIME MINISTER’S OFFICE (DR. JITENDRA SINGH)
(a) to (c): Every year, the Union Public Service Commission (UPSC) conducts its Examinations as per the Programme of Examinations (Calendar)year notified by the Commission well in advance for a calendar year.
The number of vacancies advertised and number of candidates recommended during the last ten years are as under:
| Year | No. of Vacancies* | No of Candidates Recommended** |
| 2012-13 | 5681 | 5705 |
| 2013-14 | 11326 | 8852 |
| 2014-15 | 8347 | 8272 |
| 2015-16 | 8096 | 6866 |
| 2016-17 | 6726 | 5735 |
| 2017-18 | 5729 | 6294 |
| 2018-19 | 5207 | 4399 |
| 2019-20 | 5913 | 5230 |
| 2020-21 | 4997 | 4214 |
| 2021-22 | 5153 | 4119 |
*Recommendation to some of the reported vacancies might have been made in the subsequent year.
**may include recommendation to vacancies reported the preceding year.
(d): The details of allotted Budget (Charged) under Major Head 2051-UPSC for the last ten years are as under:
| Financial Year | Final Grant (in Crore) | Actual Expenditure(in Crore) |
| 2012-13 | 146.53 | 146.52 |
| 2013-14 | 166.64 | 166.62 |
| 2014-15 | 188.81 | 188.72 |
| 2015-16 | 213.00 | 212.94 |
| 2016-17 | 241.85 | 241.78 |
| 2017-18 | 241.30 | 240.99 |
| 2018-19 | 280.75 | 280.64 |
| 2019-20 | 298.16 | 297.96 |
| 2020-21 | 285.00 | 284.93 |
| 2021-22 | 316.18 | 316.16 |
(e): As on 01.07.2022, the total number of employees working in UPSC is 1238.
****
Source: Lok Sabha PDF


COMMENTS